
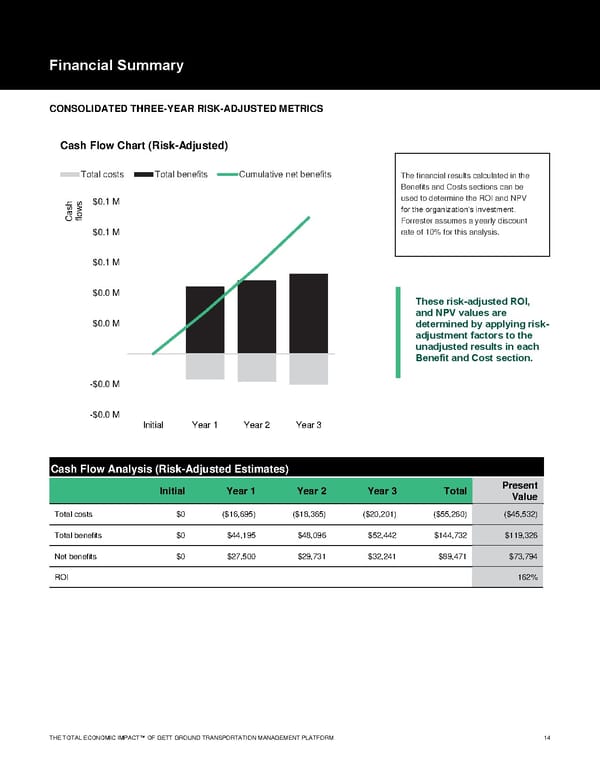
THE TOTAL ECONOMIC IMPACT™ OF GETT GROUND TRANSPORTATION MANAGEMENT PLATFORM 14 Financial Summary C ONSOLIDATED T HREE - Y EAR R ISK - A DJUSTED M ETRICS -$0.0 M -$0.0 M $0.0 M $0.0 M $0.1 M $0.1 M $0.1 M Initial Year 1 Year 2 Year 3 Cash flows Cash Flow Chart (Risk - Adjusted) Total costs Total benefits Cumulative net benefits These risk - adjusted ROI, and NPV values are determined by applying risk - adjustment factors to the unadjusted results in each Benefit and Cost section. The financial results calculated in the Benefits and Costs sections can be used to determine the ROI and NPV for the organization’s investment. Forrester assumes a yearly discount rate of 10% for this analysis. Cash Flow Analysis (Risk - Adjusted Estimates) Initial Year 1 Year 2 Year 3 Total Present Value Total costs $0 ($16,695) ($18,365) ($20,201) ($55,260) ($45,532) Total benefits $0 $44,195 $48,096 $52,442 $144,732 $119,326 Net benefits $0 $27,500 $29,731 $32,241 $89,471 $73,794 ROI 162%
 Report Page 15 Page 17