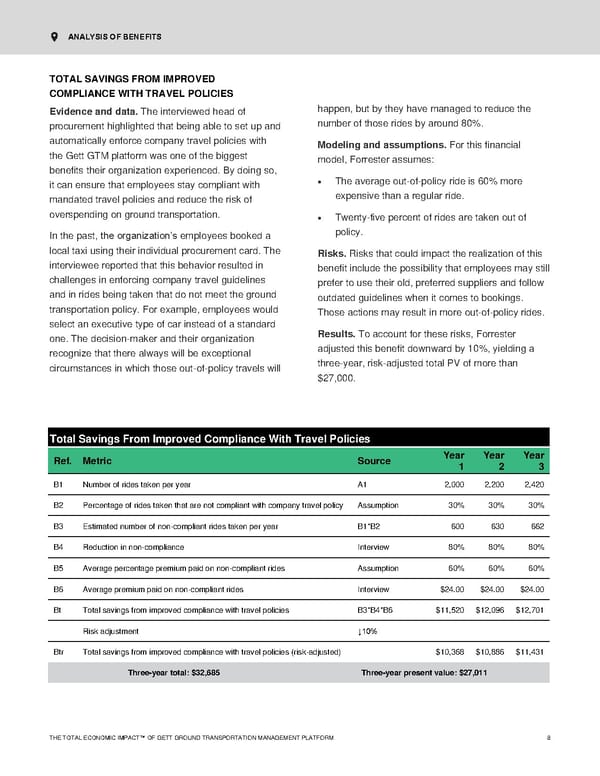
THE TOTAL ECONOMIC IMPACT™ OF GETT GROUND TRANSPORTATION MANAGEMENT PLATFORM 8 ANALYSIS OF BENEFITS TOTAL SAVINGS FROM IMPROVED COMPLIANCE WITH TRAVEL POLICIES Evidence and d ata. The interviewe d head of procurement highlighted that being able to set up and automatically enforce company travel policies with the Gett GTM platform was one of the biggest benefits their organization experienced. By doing so, it can ensure that employees stay compliant with mandated trave l policies and reduce the risk of overspending on ground transportation. In the past, the organization’s employees book ed a local taxi using their individual procurement card. The interviewee reported that this behavior resulted in challenges in enforcing company travel guidelines and in rides being taken that do not meet the ground transportation policy. F or example , employ ees would select an executive type of car instead of a standard one. The decision - maker and their organization recognize that there always will be exceptional circumstances in which those out - of - policy travels will happen, but by they have managed to reduce the number of those rides by around 80%. Modeling and a ssumptions. For this financial model, Forrester a ssumes: • The average out - of - policy ride is 60% more expensive than a regular ride. • T wenty - five percent of rides are taken out of policy. Risks. Risks that could impact the realization of this benefit include the possibility that e mployees may still prefer to use their old, preferred suppliers and follow outdated guidelines when it comes to bookings . T hose actions may result in more out - of - policy rides. Results. To account for these risks, Forrester adjusted this benefit downward by 10%, yielding a three - ye ar, risk - adjusted total PV of more than $27,0 00 . Total Savings From Improved Compliance With Travel Policies Ref. Metric Source Year 1 Year 2 Year 3 B1 Num b er of rides taken per year A1 2,000 2,200 2,420 B2 Percentage of rides taken that are not compliant with company travel policy Assumption 30% 30% 30% B3 Estimated number of non - compliant rides taken per year B1*B2 600 630 662 B4 Reduction in non - compliance Interview 80% 80% 80% B5 Average percentage premium paid on non - compliant rides Assumption 60% 60% 60% B6 Average premium paid on non - compliant rides Interview $24.00 $24.00 $24.00 Bt Total savings from improved compliance with travel policies B3*B4*B6 $11,520 $12,096 $12,701 Risk adjustment ↓10% Btr Total savings from improved compliance with travel policies (risk - adjusted) $10,368 $10,886 $11,431 Three - year total: $32,685 Three - year present value: $27,011
 Report Page 9 Page 11