
Report
The Total Economic Impact™ Of Gett Ground Transportation Management Platform | 19 pages
A FORRESTER TOTAL ECONOMIC IMPACT™ STUDY COMMISSIONED BY GETT The Total Economic Impact™ Of Gett Ground Transportation Management Platform Cost Savings And Business Benefits Enabled By Get t G round T ransportation Management P latform JANUARY 2022
THE TOTAL ECONOMIC IMPACT™ OF GETT GROUND TRANSPORTATION MANAGEMENT PLATFORM Table O f Contents Executive Summary ................................ ................. 1 The Gett GTM Platform Customer Journey ........... 5 Interviewee’s Organization ................................ ..... 5 Key Challenges ................................ ...................... 5 Gett Deployment ................................ .................... 5 Analysis Of Benefits ................................ ................ 6 Total Cost Savings On Rides ................................ . 7 Total Savings From Improved Compliance With Travel Policies ................................ ........................ 8 Time Savings On Processing Ground Trav el Expense Claims ................................ ..................... 9 Total Time Savings On Expense Claims Submissions ................................ ......................... 10 Savings From Fraud Protection ........................... 11 Unquantified Benefits ................................ ........... 12 Flexibility ................................ ............................... 12 Analysis Of Costs ................................ .................. 13 Total Gett Fees ................................ ..................... 13 Financial Summary ................................ ................ 14 Appendix A: Total Economic Impact ................... 15 Appendix B: Endnotes ................................ .......... 16 Consulting Team: Oskar Piorkowski Josephine Phua ABOUT FORRESTER CONSULTING Forrester Consulting provides independent and objective research - based consulting to help leaders succeed in their organizations. For more information, visit forrester.com/consulting. © Forrester Research, Inc. All rights reserved. Unauthorized reproduction is strictly prohibited. Information is based on the best available resources. Opinions reflect judgment at the time and are subject to change. Forrester ® , Technographics ® , Forrester Wave, RoleView, TechRadar, and Total Economic Impact are trademarks of Forrester Research, Inc. All other trademarks are the property of their respective companies.
THE TOTAL ECONOMIC IMPACT™ OF GETT GROUND TRANSPORTATION MANAGEMENT PLATFORM 1 Executive Summary As corporate travelers become exposed to an increased number of ground transportation vendors, the challenge of managing and consolidating those providers into one centralized place has become more apparent. The corporate ground transportation management rema ins fragmented with very few organizations having full visibility of the volume and costs associated with it. Leading organizations need tools to manage and control their spend in real - time as well as to ensure safety of their employees. Gett provides a technology platform to help organizations manage corporate gro und transportation spend. Gett commissioned Forrester Consulting to conduct a Total Economic Impact™ (TEI) study and examine the potential return on investment (ROI) enterprises may realize by deploying its g round t ransportation m anagement (GTM) p latform . The purpose of this study is to provide readers with a framework to evaluate the potential financial impact of Gett's GTM platform on their organizations. To better understand the benefits, costs, and risks associated with this in vestment, Forrester interviewed the decision - maker of an organization who has experience using Gett ’s GTM platform . Forrester used this experience to project a three - year financial analysis. Prior to using Gett ’s GTM platform , the interviewee noted how th eir organization struggled to monitor and manage ground transportation spend. Even though there were company travel policies in place, the organization faced practical challenges in enforcing those rules. Moreover, the processes of booking and managing rid es as well as submitting and processing expense claims were inefficient and time - consuming. KEY FINDINGS Gett’s GTM platform provided the organization with the opportunity to set up, adjust and enforce company travel policies and reduce the overall number of out - of - policy rides taken. It also removed many of the inefficiencies associated with tr av e l expense management. Quantified benefits. Risk - adjusted present value (PV) quantified benefits include: • To tal cost savings on rides. Gett consolidates ride options from different vendors on its platform, allowing users to compare prices and select the most affordable option , without having to compromise on convenience . The eas y access to lowe r - priced rides helped the organization sav e about $52,000 over three years. • Total s avings from improved compliance with travel policies. Prior to Gett , the organization found it difficult to efficiently enforce its employee travel policies. As a result, employees often ended up taking rides that were not compliant with its travel policies. With Gett , users are only presented with ride options tha t they qualify for, allowing the organization to enforce its travel policies smoothly. By reducing the number of Return on investment (ROI) 162% Net present value (NPV) $74K KEY STATISTICS
THE TOTAL ECONOMIC IMPACT™ OF GETT GROUND TRANSPORTATION MANAGEMENT PLATFORM 2 EXECUTIVE SUMMARY noncompliant rides taken, the organization was able to save over $2 7,000 over three years. • Time savings on processing ground travel expense claims. The organization’s finance team used to spend hours each month manually processing employees’ expense claims submissions — verifying trip details, following up on discrepancies and errors, etc. Gett helped to automate the entire ground travel expense management process, saving the organization close to 1,000 hours over three years, translating to $ 22, 0 00 in resource savings over three years. • Total time savings on expense claims submissions. Similarly, migrating to Gett's platform also made the expense management process more streamlined for employees. They no longer had to spend time and effort on submitting expense claims, which saved the organization significant time and resources amounting to over $12, 0 00 over three years. • Savings from fraud protection . Another common issue related to expense management that organizations often deal with is fraud. With ground transport ation , fraud may come in two forms: supplier overcharging or employees overinflating expenses. Gett provides transparency in fees for both riders and the organization, eliminating the risk of fraudulent claims. For the interviewed organization, fraud avoidance is estimated to save approximately $ 5,9 00 over three years. Unquantified benefits. The customer also shared some additional benefits that were not quantified and included in the financial model above: • New insight into the organization’s ground transport ation spend ing . Prior to Gett , the organization’s management had very little ins ight on why or how ground transportation costs were adding up, and it took a lot of manual work to perform general estimates or analysis. Gett allowed the organization to easily get insight into th eir overall ground transportation s pend. • Increased visibility on staff movement and safety. The interviewee shared that their employees often have to travel home late at night . In some cases, when taxis were not readily available, they had to wait in the dark fo r a long time for their ride. With Gett, ride bookings can be made en masse and employee movement can be monitored centrally for safety assurance. • Insight on its carbon footprint. Gett helps the organization keep track of the number of miles its employees have traveled, including carbon emissions estimated based on the types of ride s they use . Organizations can also report the se findings to executive bodies or legal entities. • Impro ved employee experience. The interviewee reported that employees are enjoying the convenience and flexibility of using Gett . The app is user - friendly and provides the same convenience that employees would find in any consumer - facing app th at they would usually use . Costs. Risk - adjusted PV costs include: • Total Gett fees. These amount to $ 45 ,500 over three years. The interview and financial analysis found that the decision - maker’s organization experiences benefits of over $119,000 over three years versus costs of $4 5 , 5 00 , adding up to a net present value (NPV) of about $74,000 and an ROI of 1 62 % . Total cost savings ( lower priced rides, fraud prevention and improved compliance ) 29%
THE TOTAL ECONOMIC IMPACT™ OF GETT GROUND TRANSPORTATION MANAGEMENT PLATFORM 3 EXECUTIVE SUMMARY TOTAL COST SAVING ROI 162% BENEFITS PV $119K NPV $74K $52.0K $27.0K $22.2K $12.3K $5.9K Total cost savings on rides Total savings from improved compliance with travel policies Time savings on processing ground travel expense claims Total time savings on expense claims submissions Savings from fraud protection Benefits (Three - Year)
THE TOTAL ECONOMIC IMPACT™ OF GETT GROUND TRANSPORTATION MANAGEMENT PLATFORM 4 EXECUTIVE SUMMARY TEI FRAMEWORK AND METHODOLOGY From the information provided in the interviews, Forrester constructed a Total Economic Impact™ framework for those organizations considering an investment in the Gett ground transportation management platform . The objective of the framework is to identify the cost, benefit, flexibility, and risk factors that affect the investment decision. Forrester took a multistep approach to evaluate the impact that Gett's GTM platform can have on an organization . DUE DILIGENCE Interviewed Gett stakeholders and Forrester analysts to gather data relevant to the industry and solution . DECISION - MAKER INTERVIEW Interviewed the decision - maker of an organization using the Gett GTM platform to obtain data with respect to costs, benefits, and risks. FINANCIAL MODEL FRAMEWORK Constructed a financial model representative of the interview using the TEI methodology and risk - adjusted the financial model based on issues and concerns of the decision - maker. CASE STUDY Employed four fundamental elements of TEI in modeling the investment impact: benefits, costs, flexibility, and risks. Given the increasing sophistication of ROI analyses related to IT investments, Forrester’s TEI methodology provides a complete picture of the total economic impact of purchase decisions. Please see Appendix A for additional information on the TEI methodology. DISCLOSURES Readers should be aware of the following: This study is commis sioned by Gett and delivered by Forrester Consulting. It is not meant to be used as a competitive analysis. Forrester makes no assumptions as to the potential ROI that other organizations will receive. Forrester strongly advises that readers use their own estimates within the framework provided in the study to determine the appropriateness of an investment in Gett. Gett reviewed and provided feedback to Forrester, but Forrester maintains editorial control over the study and its findings and does not accept changes to the study that contradict Forrester’s findings or obscure the meaning of the study. Gett provided the customer name for the interview but did not participate in the interview.
THE TOTAL ECONOMIC IMPACT™ OF GETT GROUND TRANSPORTATION MANAGEMENT PLATFORM 5 The Gett GTM Platform Customer Journey Drivers leading to the Gett GTM platform investment INTERVIEWEE’S ORGANIZATION To build the financial model used in this study, Forrester interviewed the decision - maker of an organization who had been using the Gett GTM platform for the past eight years. This organization is a non - profit , government institution based in the United Kingdom with an annual revenue of $150 million. It has 1,200 employees, who take, on average, 2,000 rides per year. The interv iewee is the organization’s h ead of procurement . KEY CHALLENGES Prior to investing in Gett, the organization’s ground transportation budget went largely unmanaged. It had limited visibility to understand why some of its employees were using taxis and where they were traveling to and from. There were no mandates or policies on what sort of transport ( e.g., ride hail, black taxis, private hire cabs, etc.) should be used depending on the reason for the journey or the seniori ty level within an organization. Employees had no choice but to use their provider of choice and had to follow outdated legacy workflows for planning, booking, and submitting expense claims. The interviewee noted how their organization struggled with commo n challenges, including: • Multiple suppliers and contracts without one central consolidated approach. The organization w as partnering with Gett and one another big supplier with which it had a central contract . H owever , it was not mandated to prioritize par tners over other vendors. Employees were using whatever was convenient for them at the time . • Low enforcement of company policy travels. There were no clear guidelines and policies on what procedures employees should follow when they book ground transportat ion. Unlike the hotel or airplane bookings, employees could easily select premium executive rides even if their reason or level within the organization didn’t allow them to do so. • Wasted time on inefficient back - office operations and claims expense submis sions. Without an automated process of submitting and processing expense claims, its finance and accounting teams , as well as other employees , spent a significant amount of time on manual, low - value work. GETT D EPLOYMENT By deploying Gett's ground transp ortation management platform , the organization hoped to streamline its ground travel expense management processes and consolidate different suppliers into one experience , without compromising on convenience or safety for employees. Company overview • Government , non - profit institution • $ 150 million in annual revenue • 1,200 employees • 2,000 rides per year
THE TOTAL ECONOMIC IMPACT™ OF GETT GROUND TRANSPORTATION MANAGEMENT PLATFORM 6 Analysis O f Benefits Quantified benefit data Total Benefits Ref. Benefit Year 1 Year 2 Year 3 Total Present Value Atr Total cost savings on rides $19,080 $20,988 $23,087 $63,155 $52,036 Btr Total savings from improved compliance with travel policies $10,368 $10,886 $11,431 $32,685 $27,011 Ctr Time savings on processing ground travel expense claims $8,100 $8,910 $9,882 $26,892 $22,152 Dtr Total time savings on expense claims submissions $4,500 $4,950 $5,445 $14,895 $12,273 Etr Savings from fraud protection $2,147 $2,361 $2,597 $7,105 $5,854 Total benefits (risk - adjusted) $44,195 $48,096 $52,442 $144,732 $119,326
THE TOTAL ECONOMIC IMPACT™ OF GETT GROUND TRANSPORTATION MANAGEMENT PLATFORM 7 ANALYSIS OF BENEFITS TOTAL COST SAVINGS ON RIDES Evidence and data. By using the Gett GTM platform , employees at the decision - maker’s organization have a choice of multiple ground transportation suppliers aggregated in one platform based on their need, preference, and eligibility. The interviewee highlighted their organization’s savings from the ability to adjust vendor preferences and selecting more price - sensitive rides. In the past, employees us ed their preferred supplier of ground transportation with out knowing whether they were eligible for that type of transport or whether that was the most price efficient type of ride. With Gett, employees have a clear view on real - time price comparisons between vendors and clarity on their eligibility for the type s of rides they wish to book. Modeling and a ssumptions. For this financial model, Forrester assumes: • Employees of the organization complete around 2,000 rides in Y ear 1 . A s the organization grows, the number of rides taken increases by about 10% each year. • The average price per ride is $53. Risks. Risks that could impact the realization of this benefit include: • Employees may be used to certain ground transportation suppliers and may keep choosing to select rides with those suppliers even if they are more expensive than other vendors. • COVID - 1 9 changing the manner and frequency of business travel . T here may be a decreased need for business travel in the coming years. Results. To account for these risks, Forrester adjusted this benefit downward by 10 %, yielding a three - year , risk - adjusted tota l PV (discounted at 10%) of over $ 52, 0 00 . Total Cost Savings On Rides Ref. Metric Source Year 1 Year 2 Year 3 A1 Num b er of rides taken per year Interview 2,000 2,200 2,420 A2 Average price per ride Interview $53.00 $53.00 $53.00 A3 Average savings per ride Interview 20% 20% 20% A4 Cost savings per ride A2*A3 $10.60 $10.60 $10.60 At Total cost savings on rides B1*B3 $21,200 $23,320 $25,652 Risk adjustment ↓10% Atr Total cost savings on rides (risk - adjusted) $19,080 $20,988 $23,087 Three - year total: $63,155 Three - year present value: $52,036 “ Gett helped us save around £5,000 a year from our incumbent private hire provider .” Head of procurement, non - profit government organization
THE TOTAL ECONOMIC IMPACT™ OF GETT GROUND TRANSPORTATION MANAGEMENT PLATFORM 8 ANALYSIS OF BENEFITS TOTAL SAVINGS FROM IMPROVED COMPLIANCE WITH TRAVEL POLICIES Evidence and d ata. The interviewe d head of procurement highlighted that being able to set up and automatically enforce company travel policies with the Gett GTM platform was one of the biggest benefits their organization experienced. By doing so, it can ensure that employees stay compliant with mandated trave l policies and reduce the risk of overspending on ground transportation. In the past, the organization’s employees book ed a local taxi using their individual procurement card. The interviewee reported that this behavior resulted in challenges in enforcing company travel guidelines and in rides being taken that do not meet the ground transportation policy. F or example , employ ees would select an executive type of car instead of a standard one. The decision - maker and their organization recognize that there always will be exceptional circumstances in which those out - of - policy travels will happen, but by they have managed to reduce the number of those rides by around 80%. Modeling and a ssumptions. For this financial model, Forrester a ssumes: • The average out - of - policy ride is 60% more expensive than a regular ride. • T wenty - five percent of rides are taken out of policy. Risks. Risks that could impact the realization of this benefit include the possibility that e mployees may still prefer to use their old, preferred suppliers and follow outdated guidelines when it comes to bookings . T hose actions may result in more out - of - policy rides. Results. To account for these risks, Forrester adjusted this benefit downward by 10%, yielding a three - ye ar, risk - adjusted total PV of more than $27,0 00 . Total Savings From Improved Compliance With Travel Policies Ref. Metric Source Year 1 Year 2 Year 3 B1 Num b er of rides taken per year A1 2,000 2,200 2,420 B2 Percentage of rides taken that are not compliant with company travel policy Assumption 30% 30% 30% B3 Estimated number of non - compliant rides taken per year B1*B2 600 630 662 B4 Reduction in non - compliance Interview 80% 80% 80% B5 Average percentage premium paid on non - compliant rides Assumption 60% 60% 60% B6 Average premium paid on non - compliant rides Interview $24.00 $24.00 $24.00 Bt Total savings from improved compliance with travel policies B3*B4*B6 $11,520 $12,096 $12,701 Risk adjustment ↓10% Btr Total savings from improved compliance with travel policies (risk - adjusted) $10,368 $10,886 $11,431 Three - year total: $32,685 Three - year present value: $27,011
THE TOTAL ECONOMIC IMPACT™ OF GETT GROUND TRANSPORTATION MANAGEMENT PLATFORM 9 ANALYSIS OF BENEFITS TIME SAVINGS ON PROCESSING GROUND TRAVEL EXPENSE CLAIMS Evidence and data. Another key benefit of the Gett GTM platform that the interviewee highlighted was the time and effort savings in back - office operations for the accounting and finance teams. Before they fully deployed Gett's ground transportation management platform , the organization had a team of three separate finance s taff managing and processing all ground transportation expense claims from multiple vendors. They would have to manually verify claims against submitted receipts, and then bill these claims to relevant business departments. With the Gett GTM platform , this entire process is automated and the finance team receives one monthly vendor invoice from Gett . T hese ride expenses are automatically billed to the right department based on employees’ preprogrammed department codes. Before working with Gett, the finance team also had to spend additional time following up on incomplete expense claims (e.g., missing time/date details, reasons for travel, etc.), clarifying discrepancies and irregularities in claims, or enforcing company policies. The interviewee estimate d that with the full deployment of Gett, the organization is now able to save around 25 hours a month for the five team members that were previously handling these tasks. Modeling and assumptions. For this financial model, Forrester assumes that a ccountants and financial assistants each spend 5 hours per month on activities related to claims processing in Year 1. As the organization and the number of rides taken grow s , the time burden on employees increases too. Risks. Some factors that could impac t the realization of this benefit include: • Employees using the Gett GTM platform may face different level s of service or transport availability based on the ir location, which may result in reluctance to switch to Gett . • Organizational inertia to change, as employees are simply used to long - established behavior and preferences . Results. To account for these risks, Forrester adjusted this benefit downward by 10 %, yielding a three - year, risk - adjusted total PV of over $ 22, 000 . Time Savings On Processing Ground Travel Expense Claims Ref. Metric Source Year 1 Year 2 Year 3 C1 Number of finance staff involved in processing expense claims I nterview s 5 5 5 C2 Hours spent processing ground travel expenses per employee per month Interview s 5.0 5.5 6.1 C3 Annual time spent on processing ground travel expenses A1*A2*12 300 330 366 C4 Average hourly salary for finance staff TEI standard $30.00 $30.00 $30.00 Ct Time savings on processing ground travel expense claims A3*A4 $9,000 $9,900 $10,980 Risk adjustment ↓10% Ctr Time savings on processing ground travel expense claims (risk - adjusted) $8,100 $8,910 $9,882 Three - year total: $26,892 Three - year present value: $22,152
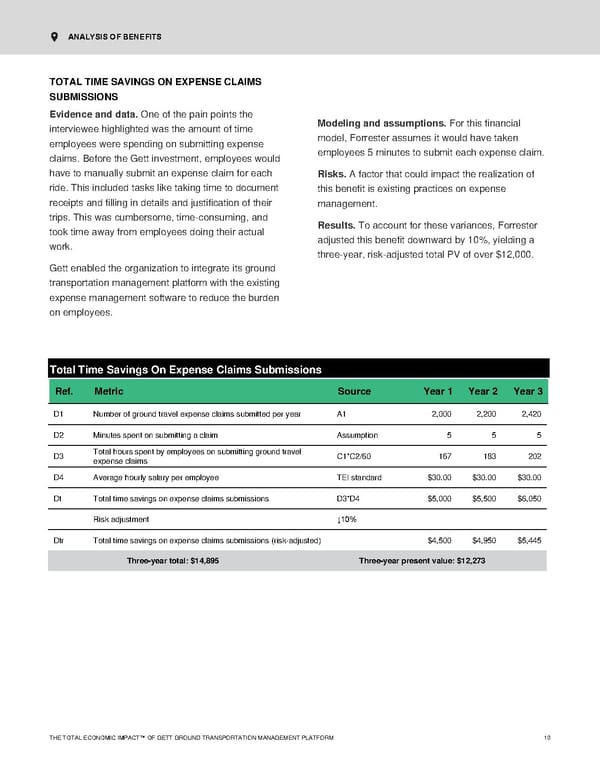
THE TOTAL ECONOMIC IMPACT™ OF GETT GROUND TRANSPORTATION MANAGEMENT PLATFORM 10 ANALYSIS OF BENEFITS TOTAL TIME SAVINGS ON EXPENSE CLAIMS SUBMISSIONS Evidence and data. One of the pain points the interviewee highlighted was the amount of time employees were spending on submitting expense claims. Before the Gett investment , employees would have to manually submi t an expense claim for each ride . This includ ed tasks like taking time to document receipts and filling in details and justification of their trips. This was cumbersome, time - consuming , and took time away from employees doing their actual work. Gett enabl ed the organization to integrate its ground transportation management platform with the existing expense management software to reduce the burden on employees. Modeling and assumptions. For this financial model, Forrester assumes i t would have taken employees 5 minutes to submit each expense claim. Risks. A factor that could impact the realization of this benefit is e xisting practices on expense management. Results. To account for these variances, Forrester adjusted this benefit downward by 10%, yielding a three - year, risk - adjusted total PV of over $12, 000. Total Time Savings On Expense Claims Submissions Ref. Metric Source Year 1 Year 2 Year 3 D1 Number of ground travel expense claims submitted per year A1 2,000 2,200 2,420 D2 Minutes spent on submitting a claim Assumption 5 5 5 D3 Total hours spent by employees on submitting ground travel expense claims C1*C2/60 167 183 202 D4 Average hourly salary per employee TEI standard $30.00 $30.00 $30.00 Dt Total time savings on expense claims submissions D3*D4 $5,000 $5,500 $6,050 Risk adjustment ↓10% Dtr Total time savings on expense claims submissions (risk - adjusted) $4,500 $4,950 $5,445 Three - year total: $14,895 Three - year present value: $12,273
THE TOTAL ECONOMIC IMPACT™ OF GETT GROUND TRANSPORTATION MANAGEMENT PLATFORM 11 ANALYSIS OF BENEFITS SAVINGS FROM FRAUD PROTECTION Evidence and data. Another expense management issue that organizations often have to deal with is fraud. In ground transport ation , fraud may come in two forms: supplier overcharging or employees overinflating expe nses. While the interviewee had no concrete data to share on how the Gett GTM platform impacted their fraud risk, several external studies shine light on the prevalence of fraud in this field . 1 , 2 , 3 Modeling and assumptions. For this financial model, Forrester uses statistics from these studies to estimate how much fraud would cost the interviewee ’s organization. Risks. Some factors that ca n impact the savings organizations can experience from fraud avoidance include: • The overall risk of fraud in locations the organization operations in . • Current practices and systems in place to mitigate fraud risk Results. To account for these risks, Forrester adjusted this benefit downward by 10%, yielding a three - year, risk - adjusted total PV of almost $5, 900 . Savings From Fraud Protection Ref. Metr ic Source Year 1 Year 2 Year 3 E1 Incidence of suppliers overcharging or employees overinflating expense claims Assumption 15% 15% 15% E2 Number of expense claims suspected to be overinflated E1*D1 300 330 363 E3 Average overcharge Assumption 15% 15% 15% Et Savings from fraud protection E2*E3*A2 $2,385 $2,624 $2,886 Risk adjustment ↓10% Etr Savings from fraud protection (risk - adjusted) $2,147 $2,361 $2,597 Three - year total: $7,105 Three - year present value: $5,854 Total cost savings ( lower priced rides, fraud prevention and improved compliance ) 29%
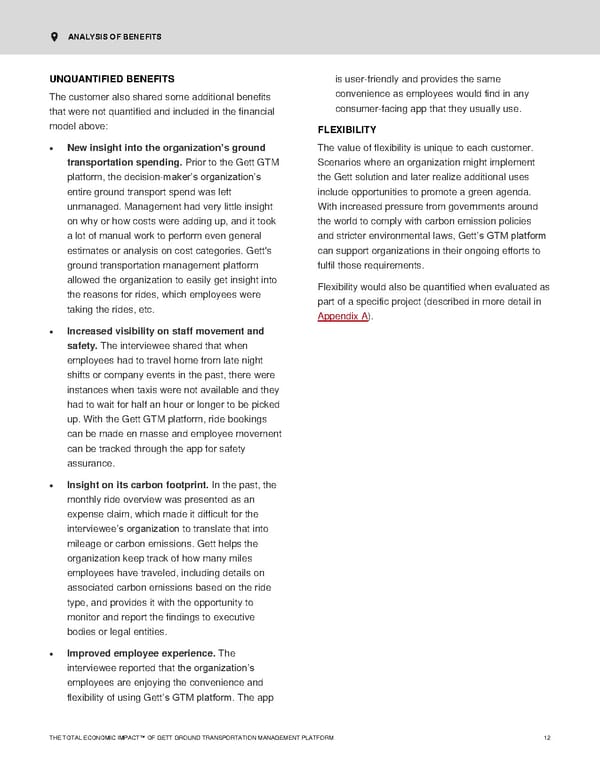
THE TOTAL ECONOMIC IMPACT™ OF GETT GROUND TRANSPORTATION MANAGEMENT PLATFORM 12 ANALYSIS OF BENEFITS UNQUANTIFIED BENEFITS The customer also shared some additional benefits that were not quantified and included in the financial model above: • New insight into the organization’s ground transport ation spending . Prior to the Gett GTM platform , the decision - maker’s organization’s entire ground transport spend was left unmanaged. Management had very little insight on why or how costs were adding up, and it took a lot of manual work to perform even general estimates or analysis on cost categories. Gett's ground transpo rtation management platform allowed the organization to easily get insight into the reasons for rides, which employees were taking the rides, etc. • Increased visibility on staff movement and safety. The interviewee shared that when employees had to travel home from late night shifts or company events in the past , there were instances when taxis were not available and they had to wait for half an hour or longer to be picked up. With the Gett GTM platform, ride bookings can be made en masse and employee move ment can be tracked through the app for safety assurance . • Insight on its carbon footprint. In the past, the monthly ride overview was presented as an expense claim , which made it difficult for the interviewee ’s organization to translate that into mileage o r carbon emissions. Gett helps the organization keep track of how many miles employees have traveled, including details on associated carbon emissions based on the ride type, and provides it with the opportunity to monitor and report the findings to execut ive bodies or legal entities. • Improved employee experience. The interviewee reported that the organization’s employees are enjoying the convenience and flexibility of using Gett ’s GTM platform . The app is user - friendly and provides the same convenience as employees would find in any consumer - facing app that they usually use. F LEXIBIL I TY The value of flexibility is unique to each customer. S cenarios where a n organization might implement the Gett solution and later realize additional uses include o pportunities to promote a g reen a genda. With increased pressure from governments around the world to comply with carbon emission policies and stricter environmental laws, Gett ’s GTM platform can supp ort organizations in their ongoing efforts to fulfil those requirements. Flexibility would also be quantified when evaluated as part of a specific project (described in more detail in Appendix A ).
THE TOTAL ECONOMIC IMPACT™ OF GETT GROUND TRANSPORTATION MANAGEMENT PLATFORM 13 Analysis O f Costs Quantified cost data TOTAL GETT FEES Evidence and d ata. The costs associated with the investment in Gett are commission fees that total of 15% of the total ride value. This commission rate is unique to the interviewee’s organization and will vary by organization size and use case. Results. To be conservative, Forrester adjusted this cost upward by 5%, yielding a three - year, risk - adjusted total PV (discounted at 10%) of over $45, 5 00 . Total Costs Ref. Cost Year 1 Year 2 Year 3 Total Present Value Ftr Total Gett fees $16,695 $18,365 $20,201 $55,260 $45,532 Total costs (risk - adjusted) $16,695 $18,365 $20,201 $55,260 $45,532 Total Gett Fees Ref. Metric Calculation Year 1 Year 2 Year 3 F1 Num b er of rides taken per year A1 2,000 2,200 2,420 F2 Average price per ride A2 $53.00 $53.00 $53.00 F3 Gett's commission rate Interview 15.0% 15.0% 15.0% Ft Total Gett fees E1*E2*E3 $15,900 $17,490 $19,239 Risk adjustment ↑5% Ftr Total Gett fees (risk - adjusted) $16,695 $18,365 $20,201 Three - year total: $55,260 Three - year present value: $45,532 “We did not have to pay anything up front [ to Gett] ... and the implementation was actually quite swift.” Head of procurement, non - profit government organization
THE TOTAL ECONOMIC IMPACT™ OF GETT GROUND TRANSPORTATION MANAGEMENT PLATFORM 14 Financial Summary C ONSOLIDATED T HREE - Y EAR R ISK - A DJUSTED M ETRICS -$0.0 M -$0.0 M $0.0 M $0.0 M $0.1 M $0.1 M $0.1 M Initial Year 1 Year 2 Year 3 Cash flows Cash Flow Chart (Risk - Adjusted) Total costs Total benefits Cumulative net benefits These risk - adjusted ROI, and NPV values are determined by applying risk - adjustment factors to the unadjusted results in each Benefit and Cost section. The financial results calculated in the Benefits and Costs sections can be used to determine the ROI and NPV for the organization’s investment. Forrester assumes a yearly discount rate of 10% for this analysis. Cash Flow Analysis (Risk - Adjusted Estimates) Initial Year 1 Year 2 Year 3 Total Present Value Total costs $0 ($16,695) ($18,365) ($20,201) ($55,260) ($45,532) Total benefits $0 $44,195 $48,096 $52,442 $144,732 $119,326 Net benefits $0 $27,500 $29,731 $32,241 $89,471 $73,794 ROI 162%
THE TOTAL ECONOMIC IMPACT™ OF GETT GROUND TRANSPORTATION MANAGEMENT PLATFORM 15 Appendix A : Total Economic Impact Total Economic Impact is a methodology developed by Forrester Research that enhances a company’s technology decision - making processes and assists vendors in communicating the value proposition of their products and services to clients. The TEI methodology helps companies demonstrate, justify, and realize th e tangible value of IT initiatives to both senior management and other key business stakeholders. TOTAL ECONOMIC IMPACT APPROACH Benefits represent the value delivered to the business by the product. The TEI methodology places equal weight on the measure o f benefits and the measure of costs, allowing for a full examination of the effect of the technology on the entire organization. Costs consider all expenses necessary to deliver the proposed value, or benefits, of the product. The cost category within TEI captures incremental costs over the existing environment for ongoing costs associated with the solution. Flexibility represents the strategic value that can be obtained for some future additional investment building on top of the initial investment alrea dy made. Having the ability to capture that benefit has a PV that can be estimated. Risks measure the uncertainty of benefit and cost estimates given: 1) the likelihood that estimates will meet original projections and 2) the likelihood that estimates will be tracked over time. TEI risk factors are based on “triangular distribution.” The initial investment column contains costs incurred at “time 0” or at the beginning of Year 1 that are not discounted. All other cash flows are discounted using the d iscount rate at the end of the year. PV calculations are calculated for each total cost and benefit estimate. NPV calculations in the summary tables are the sum of the initial investment and the discounted cash flows in each year. Sums and present value ca lculations of the Total Benefits, Total Costs, and Cash Flow tables may not exactly add up, as some rounding may occur. PRESENT VALUE (PV) The present or current value of (discounted) cost and benefit estimates given at an interest rate (the discount rate). The PV of costs and benefits feed into the total NPV of cash flows. NET PRESENT VALUE (NPV) The present or current value of (discounted ) future net cash flows given an interest rate (the discount rate). A positive project NPV normally indicates that the investment should be made, unless other projects have higher NPVs. RETURN ON INVESTMENT (ROI) A project’s expected return in percentage terms. ROI is calculated by dividing net benefits (benefits less costs) by costs. DISCOUNT RATE The interest rate used in cash flow analysis to take into account the time value of money. Organizations typically use discount rates between 8% and 16%. PAYBACK PERIOD The breakeven point for an investment. This is the point in time at which net benefits (benefits minus costs) equal initial investment or cost.
THE TOTAL ECONOMIC IMPACT™ OF GETT GROUND TRANSPORTATION MANAGEMENT PLATFORM 16 Appendix B: Endnotes 1 Source: “Taxi Drivers Overcharge When Passengers Are On Expenses,” The Economist, February 28, 2017 ( https://www.economis t.com/business/2017/02/28/taxi - drivers - overcharge - when - passengers - are - on - expenses ). 2 Source: “Report To The Nations: 2020 Global Study On Occupational Fraud And Abuse,” Association Of Certified Fraud Examiners ( https://acfepublic.s3 - us - west - 2.amazonaws.co m/2020 - Report - to - the - Nations.pdf ). 3 Source: Alexander Grous, “ Managing Every Mile: How To Deliver Greater Return On Investment From Travel And Expense,” The London School Of Economics And Political Science, September 2017 ( https://www.lse.ac.uk/business/consulting/reports/managing - every - mile ).
THE TOTAL ECONOMIC IMPACT™ OF GETT GROUND TRANSPORTATION MANAGEMENT PLATFORM 17